Wednesday, October 14, 2015

CENTOS6 + Error: xz compression not available

To fix this:
  1. yum remove epel-release
  2. Re-download the epel-release RPM
  3. Install it
  4.  "yum clean all" before "yum install pybliblzma"
  5. yum install pyliblzma

Spy on your network with EtherApe

Network monitors are invaluable tools to administrators but can be costly. However, the open source community has a free solution, EtherApe. Learn how to install, configure, and use this monitoring tool on your network.

The EtherApe network monitor is a midrange option for monitoring your network’s data traffic. As an open source network monitor, EtherApe offers a dynamic graphical interface; features IP and TCP modes; supports Ethernet, FDDI, PPP, and slip devices; filters traffic; and reads traffic from both a tcpdump file and live from the network.

In this Daily Drill Down, I will show you how to get EtherApe up and running and how to customize it to fit your needs.

Getting and installing
EtherApe is installed within the Linux operating system and requires:
  • ·        The Libpcap packet capture library, which is available from the Lawrence Berkeley National Laboratory.
  • ·        GTK+, which is available from the GTK+ site. (You'll need version 1.2 or above.)
  • ·        Libglade, which is available from the GNOME site.
  • ·        GNOME, which is also available from the GNOME site. (You'll need version 1.0 or above.)

There are two forms of installation. The first way is to install from the source code, which requires the source tarball file and is compiled and built by root using the following commands:
mv eterape-8.0.2.tar.gz /usr/local/src
cd /usr/local/src
tar xvzf etherape-0.8.2.tar.gz
cd etherape-0.8.2
./configure
make
make install


The second installation method, from rpm, requires the RPM file and is installed by root using the following command:
rpm -ivh etherape-0.8.2.i386.rpm

Once you've installed the application, run EtherApe by typing etherape at the command prompt.
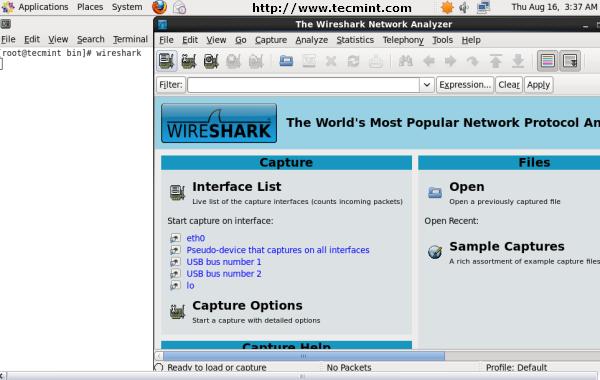
Running EtherApe
When you open EtherApe, you'll see a window much like the one shown in Figure A.

Figure A
EtherApe can track many types of network traffic.


When you start EtherApe, you may or may not see traffic depending on whether there is traffic actively passing through your network. In my case, the primary traffic displayed is WWW, SSH, and SMTP, because I host Web and e-mail servers, and I use secure shell for remote administration. Also, you'll notice that the display immediately becomes dynamic. As traffic comes in, the amount of traffic is represented by the size of the lines representing the connection. If you look at Figure A, you will notice that the WWW connection (shown in red) is approximately twice the size of the SSH connection (shown in light blue). This display tells you not only the type and relative size of traffic, but also the source of the traffic. Figure A lists both the destination (192.168.1.3) and the source (192.168.1.1 and 192.168.1.2) addresses of the packets sent. If you need to know more about the traffic passing on your network, you should open the Protocols window.

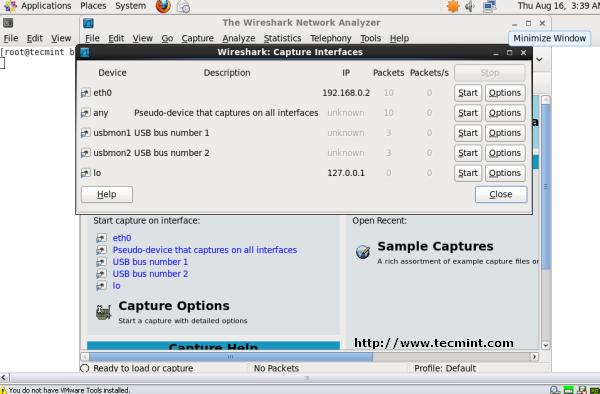
From the View drop-down menu, select Protocols to open the Protocols window (Figure B).

Figure B
The Protocol window keeps a running total of each type of packet that traverses your network.


Protocols window
The Protocols window is a great tool to use for troubleshooting your network. Suppose your network becomes extremely slow, and you have no idea why. You can use EtherApe to check on the traffic that's moving through your network. When you fire up EtherApe, you see a Web of traffic. You open the Protocols window and confirm that WWW is racking up an enormous amount of traffic. When you return to the Main window, you see that the vast amount of WWW traffic is hitting one of your backup Web servers and that traffic is coming from one specific domain. You can end this problem by blocking the domain from entering your internal network.

Blocking the offensive address is as simple as adding the suspect address to an input IP Tables chain like this.

Should your network not employ IP Tables, but instead it uses a third-party firewall solution, such as a Cisco PIX firewall or Access Lists, add the suspect address to the incoming filter rule set or Access List to block that unwanted traffic from clogging up your network. After it's blocked, you should see a drastic drop in the traffic reported by EtherApe.

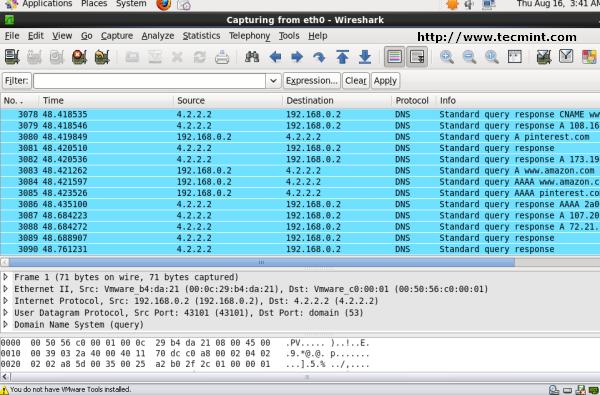
The Protocols window is also a good way to optimize your network. Take a look at Figure C. It shows an EtherApe session that has been running for over two hours. As you can see, the WWW protocol has collected the majority of traffic (7.275 MB worth) on my network. Should this be a typical reading on my network, I would know to optimize my network for WWW traffic.

Figure C
The top protocol listed is the one with the most accumulated traffic.
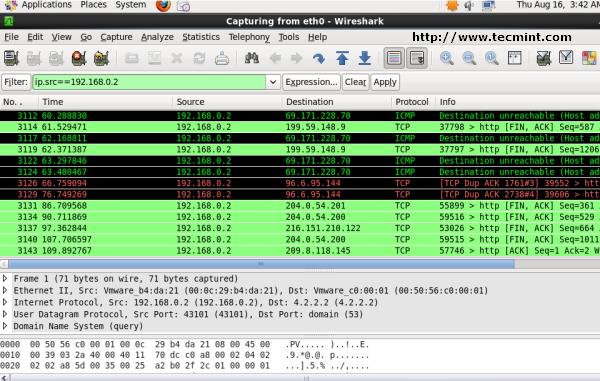

Configuration of EtherApe
To configure EtherApe, click the Stop button on the main window and then click the Pref (preferences) button to open the Configuration window (Figure D).

Figure D
Be sure to save after you make changes.


The first tab on the EtherApe Configuration window, the Diagram tab, can be used to configure some of the monitor’s protocol specifics. With the Protocol Stack Level configuration, you can specify the level of packet you want to monitor. There are five levels of the stack to watch: the Topmost Recognized Protocol (Level 1, physical medium), Level 2 (eth_II), Level 3 (IP), Level 4 (TCP and UDP), and Level 5 (HTTP). Using the Topmost level gives you more specific information about the packets traversing your network. For example, when viewing my network from Level 5, SNMP-TRAP is unknown; when viewing at Level 2, the only protocols visible are ARP and IP; when viewing at Level 4, SMTP is unknown. I tend to view at the Topmost level, because I get a better picture of the packets hitting my network hardware.

Node Size Variable is another handy configuration. Node Size allows you to dictate the direction in which EtherApe is monitoring. There are two types of traffic, instant and accumulative, and each type has three different directional patterns (in+out, inbound, and outbound).

On this same tab, you can alter the Diagram Refresh Rate. This rate count is in milliseconds, so don’t let the default 800 fool you. One thing I noticed with this particular configuration is the faster the refresh rate, the harder it is to follow the traffic. By setting the Diagram Refresh Rate at the fastest possible setting (50 milliseconds), the monitor became useless. Because of the high refresh rate, the size of the traffic and the host addresses were moving around so quickly, it looked as if I were playing an old Atari video game. However, at a much slower rate (2,000 milliseconds, for example), too much traffic is missed. On a larger network, I find it much easier to work somewhere between 500 and 700 milliseconds.

Also on the Diagram tab is the Diagram Node Timeout option, which dictates how long a node will remain in the Diagram without activity. The default setting is 6,000 milliseconds. With a multinode network, it would be wise to set this number to a lower number to make the Diagram more easily readable. For example, with a four-node network, the number of clients/servers and amount of traffic might be overwhelming. At this level of the network, there will be too many destination and source addresses shown on the screen at one time, which will prevent you from actually seeing the traffic. By allowing nodes to drop off the display (after a given amount of inactivity), the network traffic will be much more easily read.

Filters
As with all network monitors, the most important aspect of EtherApe is the filters. In a network monitor, a filter utility allows you to monitor the traffic patterns at a granular level. For example, suppose you have a large network that is bogged down because of excessive Domain traffic. Because of your network's size, you are unable to figure out where the bottleneck iscoming from. Specifying which machines you want EtherApe to monitor can help you to more quickly troubleshoot the problem.

Say your large network uses an internal IP scheme of 192.168.x.x and is broken down into departments. Each department has its own smaller network and is defined by the third quad of the IP address (x.x.Y.x, where Y is the defining quad). To configure EtherApe to watch only one particular group of addresses, you would first open the Preferences window and select the Capture tab. The top left drop-down list (labeled Capture Filter) is where you will enter the filter syntax, which for EtherApe is src net IP_ADDRESS dst net IP_ADDRESS (where IP_ADDRESS is the actual IP address of the machine, or machines, you wish to monitor). So if you want to monitor the data processing department whose IP addresses use the range 192.168.1, you would enter src net 192.168.1 dst net 192.168.1 to create this filter. Notice that there is no trailing dot at the end of the unfinished dotted quad address. The unfinished addresses tell EtherApe that it must watch a range of addresses and not a single address. You can enter a single address, or you can enter either a source (src) or destination (dst) only.

Once you enter the filter, you will save and then click OK. The filter will then begin running. One very nice touch is that as you create new filters, they will all appear in the Capture Filter drop-down list. This allows you to switch between filters quickly, without having to reenter them.

Reading from files and remote networks
EtherApe’s ability to read from a tcpdump file is good, because it allows an administrator to capture network traffic to a file and analyze that traffic either off-line or at a more convenient time.

To take advantage of this feature, the tcpdump command—which will generate the file for EtherApe to read—must be employed with the -n and -w switches. The -n switch tells tcpdump not to resolve IP addresses, and the -w switch instructs tcpdump to write packets to a specified file instead of stdout. First, you have to capture the network traffic by dumping it to a file. To dump network traffic to a file, open a terminal window, su to root, and run the command /usr/sbin/tcpdump -n -w dump_file. Instead of getting your Bash prompt returned, you will see tcpdump: listening on eth0. Once you feel you have sufficient traffic saved to your file (running this command for two to five minutes will provide you with more than enough traffic), press [Ctrl]C, and the Bash prompt will return. Next, you'll open EtherApe and have it read the dump file. From the Bash prompt, enter the command etherape -r dump_file, and EtherApe will begin displaying the traffic listed in the file as if it were being captured in real time.

Another really handy little trick takes advantage of secure shell. You can pipe the output of a tcpdump run through an ssh session. This allows you to actually monitor a remote network with EtherApe. To do this, you must have root permissions on the remote machine and must run a command similar to this.

After you issue the command to monitor a remote network, you will be asked for the root user password. Once the root password is entered, EtherApe will open displaying the remote network traffic.

Caution
Please remember that anytime you transmit root information across a network, you run the risk of compromising the security of your network by submitting your root password across network traffic. If you choose to use EtherApe to remotely monitor a network, it would be best to use the Sudo application on the tcpdump command to allow specified nonroot users access to a root-only application. For more information on Sudo, see “Limiting root access with sudo, part 1.”

Using MTR Command Examples

How to Combine Ping and Traceroute On Linux

MTR stands for My Traceroute.
It is a powerful network diagnostic tool which combines the power of both Ping and Traceroute commands.
It enables administrator to diagnose and isolate network errors and provide helpful network status reports.

In this article, we will explain how to install, use and analyze the report provided by the MTR command.
MTR works by sending ICMP packets by incrementally increasing the TTL value to find the route between the source and the given destination.

1. Installation

On debian or Ubuntu systems use the following command:
$ sudo apt-get install mtr
On centos and fedora systems execute the following command:
$ yum install mtr

2. Execute mtr for a Domain

MTR works in two modes, a graphical mode (X11) and text based mode (ncurses). By default, mtr command runs in X11 mode.
$ mtr google.com
The above command will openup a GUI window, and display the results.

3. Launch Text Mode using –curses

Use the –curses option to run mtr in terminal mode.
$ mtr --curses google.com

                     Packets               Pings
 Host                Loss%   Snt   Last   Avg  Best  Wrst StDev
 1. mblaze.hilink     0.0%    20    3.2   2.7   2.1   3.8   0.5
 2. 10.228.129.9      0.0%    20  187.7  61.8  41.6 187.7  31.3
 3. 10.228.149.14     0.0%    20  112.1  60.2  33.2 112.1  17.8
 4. 116.202.226.145   0.0%    20   57.9  63.2  35.2 147.6  24.4
 5. 116.202.226.21    0.0%    20   35.4  70.4  35.4 211.8  48.6
 6. 72.14.219.94      0.0%    20   58.9  74.6  43.4 231.2  44.2
 7. 72.14.233.204     0.0%    20   46.9  69.8  40.3 222.5  41.9
 8. 72.14.239.20      0.0%    20   94.1 259.2  68.8 3436. 748.2
 9. 209.85.244.111    0.0%    20   86.4  97.5  72.1 232.2  34.3
10. google.com        0.0%    19  387.9 132.5  71.8 387.9  84.9
The above will run continuously in interactive mode.
In interactive mode, the result will reflect the current Round Trip Time, for each host. From the above example, the packet traveled through “mblaze.hilink”, (my local router), then through a series of “hops”, and reaches the destination.
Hops are routers or nodes in internet which through which the packet travels to reach the destination.

4. Omit Reverse DNS using –no-dns

MTR finds the hostname of each router/node by using Reverse DNS Lookup. If you want to avoid doing a reverse DNS lookup, use –no-dns option.
$ mtr --curses --no-dns google.com

                       Packets               Pings
 Host                Loss%   Snt   Last   Avg  Best  Wrst StDev
 1. 192.168.1.1       0.0%     2    3.0   2.9   2.9   3.0   0.1
 2. 10.228.129.9      0.0%     2   58.6  49.6  40.7  58.6  12.7
 3. 10.228.149.14     0.0%     2   46.1  46.8  46.1  47.6   1.0
 4. 116.202.226.145   0.0%     2   61.8  61.6  61.3  61.8   0.3
 5. 116.202.226.17    0.0%     2   42.7  39.9  37.0  42.7   4.0
 6. 72.14.215.234     0.0%     2   47.1  43.9  40.7  47.1   4.5
 7. 72.14.232.110     0.0%     2   56.9  60.7  56.9  64.4   5.3
 8. 72.14.239.22      0.0%     2  111.5  95.0  78.5 111.5  23.3
 9. 209.85.244.23     0.0%     2  126.0 102.4  78.8 126.0  33.4
10. 209.85.223.113    0.0%    10   76.4  92.7  75.4 157.3  29.5
11. 74.125.200.102    0.0%     1   78.4  78.4  78.4  78.4   0.0

5. Execute mtr in Report Mode using –report

Instead of running MTR in interactive mode, you can run it in report mode using –report. In report mode, mtr will run for the number of cycles ( default 10 ), and then prints the statistics and exit. This mode will be useful for generating statstics about network quality.
$ mtr --no-dns --report google.com

HOST: lakshmanan                  Loss%   Snt   Last   Avg  Best  Wrst StDev
  1.|-- 192.168.1.1                0.0%    10    2.5   3.0   2.4   4.2   0.6
  2.|-- 10.228.129.9               0.0%    10  235.0  74.4  34.0 235.0  67.9
  3.|-- 10.228.149.14              0.0%    10  154.8  65.5  38.7 154.8  34.8
  4.|-- 116.202.226.145            0.0%    10   60.9  66.9  48.2 102.4  15.4
  5.|-- 116.202.226.17             0.0%    10   54.1  65.1  36.0 194.5  46.8
  6.|-- 72.14.215.234              0.0%    10   44.5  78.8  39.2 252.7  64.5
  7.|-- 72.14.232.110              0.0%    10   55.7  66.4  39.1 179.8  41.8
  8.|-- 66.249.94.72               0.0%    10   68.9  90.3  68.9 133.6  18.6
  9.|-- 72.14.233.105              0.0%    10   68.8  76.3  68.8  92.2   7.3
 10.|-- 173.194.38.162             0.0%    10   88.7 107.3  72.2 293.1  65.8
In the above example, mtr run for 10 cycles and collected the statistics. Users can change the number of cycles using the -c option.

Understand MTR Report

Beyond providing the information about the path between the source and destination, MTR provides valuable statistics regarding durability of the connection.
  • Lost% – Shows the % of packets loss at each hop.
  • Snt – Shows the no:of:packets being sent.
  • Last – Latency of the last packet being sent.
  • Avg – Average latency of all packets.
  • Best – Displays the best Round Trip Time for a packet to this host (shortest RTT).
  • Wrst – Displays the worst Round Trip Time for a packet to this host (longest RTT).
  • StDev – Provides the standard deviation of the latencies to each host.
Even if the “Avg” looks good, take a look at standard deviation. If the Standard deviation is high, then it may indicate that “Avg” is skewed by some measurement error or too much fluctuation. In such a case, take a look at Best and Wrst latency to make sure the average is good.

Analyze MTR reports

1. Verify Packet Loss

There is a common practice among the service provides to “Rate Limit” the ICMP traffic. This can provide an illusion of packet loss, when in fact there is no loss. To verify whether the loss is real or due to rate limiting, check the “Loss%” of the next hop. If it shows 0.0%, then you can be sure that the “Loss%” reported is due to the ICMP rate limiting and not actual loss.
 10.|-- 209.85.250.237             0.0%    10   85.6  97.5  76.0 172.0  27.2
 11.|-- 209.85.250.203            100.0    10    0.0   0.0   0.0   0.0   0.0
 12.|-- 74.125.135.138             0.0%    10   77.2 107.3  77.2 219.5  43.5
In the above output, though it show 100.0% Loss between hop 10 and 11, the next hop 12, reports 0.0% packets loss, which means the Loss reported on hop 11, is only due to ICMP rate limiting.
If the loss continues for more than 1 hop, then it is possible that there is some packet loss. Also note that Rate limiting and Packet Loss can happen concurrently. In that case take the lowest Loss% in a sequence as actual loss.

2. Improper Destination Host Networking

 13.|-- 4.69.168.254               0.0%    10  293.3 304.7 276.0 441.0  48.5
 14.|-- 4.69.161.105              10.0%    10  287.5 291.7 261.2 393.6  40.0
 15.|-- 4.69.137.50                0.0%    10  412.2 299.2 266.9 412.2  48.6
 16.|-- 4.69.134.146              10.0%    10  260.5 281.8 260.3 320.1  22.0
 17.|-- 4.69.134.129              10.0%    10  294.7 303.5 268.0 397.8  41.8
 18.|-- 4.69.132.177              10.0%    10  287.8 341.6 262.7 470.4  77.4
 19.|-- 4.71.162.50               10.0%    10  280.8 276.0 257.8 323.2  21.3
 20.|-- ???                       100.0    10    0.0   0.0   0.0   0.0   0.0
From the above example, it may look like the packets didn’t reach the destination. But it does reach the destination. This may be a result of improperly configured host or firewall rules to drop ICMP packets.

3. Timeout and Return Route Issue

Sometimes, routers will discard the ICMP and it will be shown as ??? on the output. Alternatively there can be a problem with Return route also.
  9.|-- 209.85.244.25              0.0%    10  260.6 147.0  78.1 260.6  75.3
 10.|-- ???                       100.0    10    0.0   0.0   0.0   0.0   0.0
 11.|-- 74.125.200.100             0.0%    10   84.8 112.4  75.6 234.4  63.9
In the above example, the router at hop 10 is either not responding to ICMP or there is a problem in the return route of the packet.

Tuesday, October 13, 2015

Wireshark – Network Protocol Analyzer Tool for RHEL/CentOS/Fedora

Wireshark is a open source and freely available network analyzer tool which is shipped with most of the Linux distributions now a days. Also wireshark runs on various Unix-like operating systems i.e Mac OS X, BSD, Solaris including Windows OS as well. Wireshark is very similar to tcpdump, but has a graphical front-end, plus great filtering and sorting options are integrated within. Here, we are installing wireshark using YUM Commands in our RHEL 6.3 system.

Wireshark Requirements

You need to have following packages installed on your system, before installing wireshark tool.
  1. GTK+ : It a multi-platform tool used for creating graphical user interface
  2. Glib : It is a cross-platform tool for applications written in C language.
  3. libpcap : It is used to capture user-level packet and provides a portable framework for network monitoring.
  4. gcc : It stand for (GNU Compiler Collection) used to provide and compile C, C++ applications
The below installation instructions shows how to install Wireshark tool on RHEL 6.3/6.2/6.1/6/5.8, CentOS 6.3/6.2/6.1/6/5.8 and Fedora 17,16,15,14,13,12 using YUM command. It’ll resolved all the dependencies issues automatically and this is the beauty of yum commands.

Install Wireshark in RHEL/CentOS 6/5 and Fedora 17-12

Step 1: Installing Wireshark using Yum

To install wireshark package you need to have a root privilege, below step shows how to install it using yum tool.
[root@tecmint ~]#yum -y install wireshark

Step 2: Installing Wireshark-Gnome GUI using Yum

You must install wireshark-gnome for GUI, using yum with -y option.
[root@tecmint ~]#yum -y install wireshark-gnome

Step 3: Running Wireshark

To start wireshark, execute the following command on the terminal.
[root@tecmint ~]#wireshark
Wireshark Welcome Screen

Step 4: Wireshark Configuration and Usage

Once Wireshark is installed, start it up and to start capturing, choose a desire interfaces and press start from the Capture interfaces. You’ll see a pop-up window similar to the below.
Wireshark Capture Interface
As shown below, we can see below three pane i.e top, middle and down.
Wireshark Capturing eth0
Top : In the top pane of the Wireshark window corresponds to a single packet seen on the network. You can drill down and obtain more information by clicking on a row. This causes the bottom two window panes to fill with information.
Middle :The middle pane contains drill-down details on the packet selected in the top frame.
Bottom : The bottom window pane shows the contents of the packet in both hexadecimal and ASCII representations.

Step 5: Filter by source IP Address.

This will filter the packets only from source IP in filter tab as shown below.
ip.src==192.168.0.2
Wireshark - Filter by source IP Address
Wireshark – Filter by source IP Address

Step 6: Filter by destination IP Address

This will filter the packet view in wireshark to only those packets that have destination IP as mentioned in the filter.
ip.dst==69.171.228.70
Wireshark - Filter by destination IP Address
Wireshark – Filter by destination IP Address

Step 7: Filter by Protocol

This will filter the packet view in wireshark to only those packets that have http packets mentioned in the filter.
http
Wireshark - Filter by Protocol
Wireshark – Filter by Protocol

Step 8: Filter by || (OR) Condition

This will filter the packets that match either one or the other condition.
http||arp
Wireshark - Filter by || (OR) Condition
Wireshark – Filter by || (OR) Condition

Step 9: Filter by && (AND) condition

This will filter the packet view in wireshark to only tcp packets and have source ip as 192.168.0.2
tcp&&ip.src==192.168.0.2
Wireshark - Filter by && (AND) condition
Wireshark – Filter by && (AND) condition

Step 10 Filter by Port number

Filter by tcp port number 80.
tcp.port eq 80
Wireshark - Filter by Port number
Wireshark – Filter by Port number
Tips : In addition to above, you can click the ‘Expression…’ button to discover all the filters. Also you can save the captured data to analyze later.
This article is for those who wants to debug and analyze the packets to and from in their network interfaces. You can also try it out and share your views through comment box below.

Install IPTraf on a Centos / RHEL / Fedora Linux

IPTraf is a console-based network monitoring utility. IPTraf gathers data like TCP connection packet and byte counts, interface statistics and activity indicators, TCP/UDP traffic breakdowns, and LAN station packet and byte counts. IPTraf features include:


  • An IP traffic monitor that shows information on the IP traffic passing over your network. Includes TCP flag information, packet and byte counts, ICMP details, OSPF packet types.
  • General and detailed interface statistics showing IP, TCP, UDP, ICMP, non-IP and other IP packet counts, IP checksum errors, interface activity, packet size counts.
  • A TCP and UDP service monitor showing counts of incoming and outgoing packets for common TCP and UDP application ports
  • A LAN statistics module that discovers active hosts and shows statistics showing the data activity on them
  • TCP, UDP, and other protocol display filters, allowing you to view only traffic you're interested in.
  • Logging
  • Supports Ethernet, FDDI, ISDN, SLIP, PPP, and loopback interface types.
  • Utilizes the built-in raw socket interface of the Linux kernel, allowing it to be used over a wide range of supported network cards.
  • Full-screen, menu-driven operation.

CentOS / RHEL / Fedora Linux install IPTraf

Type the following yum command to install IPTraf:
# yum install iptraf
Sample outputs:
 
Loaded plugins: auto-update-debuginfo, protectbase, rhnplugin, security
This system is receiving updates from RHN Classic or RHN Satellite.
0 packages excluded due to repository protections
Setting up Install Process
Resolving Dependencies
--> Running transaction check
---> Package iptraf.x86_64 0:3.0.1-14.el6 will be installed
--> Finished Dependency Resolution
 
Dependencies Resolved
 
================================================================================
 Package      Arch         Version             Repository                  Size
================================================================================
Installing:
 iptraf       x86_64       3.0.1-14.el6        rhel-x86_64-server-6       316 k
 
Transaction Summary
================================================================================
Install       1 Package(s)
 
Total download size: 316 k
Installed size: 0
Is this ok [y/N]: y
Downloading Packages:
iptraf-3.0.1-14.el6.x86_64.rpm                           | 316 kB     00:00
Running rpm_check_debug
Running Transaction Test
Transaction Test Succeeded
Running Transaction
  Installing : iptraf-3.0.1-14.el6.x86_64                                   1/1
  Verifying  : iptraf-3.0.1-14.el6.x86_64                                   1/1
 
Installed:
  iptraf.x86_64 0:3.0.1-14.el6
 
Complete!
 

How do I use iptraf command?

The syntax is:
 
iptraf
iptraf [options]
iptraf -i interface_name_here
 
To start the IP traffic monitor for eth0 interface type the following command. Pass the -i all option for all interfaces:
# iptraf -i eth0
# iptraf -i all

Sample outputs:
Fig.01: iptraf in action

Access all main menus

If the iptraf is started without any command-line options, the program comes up in interactive mode, with the various facilities accessed through the main menu as follows:
# iptraf
Sample outputs:
Fig.02: iptraf with menus

To start the general interface statistics, enter:

# iptraf -g

To see the detailed statistics facility on an interface called eth0

# iptraf -d interface_name_here
# iptraf -d eth0

To see the TCP and UDP monitor on an interface called eth0

# iptraf -z interface_name_here
# iptraf -z eth0

To displays the packet size counts on an interface called eth0

# iptraf -z interface_name_here
# iptraf -z eth0

Other options

Here are other options for the program:
-l iface    - start the LAN station monitor ("-l all" for all LAN interfaces)
-B          - run in background (use only with one of the above parameters)
-t timeout  - when used with one of the above parameters, tells
              the facility to run only for the specified number of
              minutes (timeout)
-L logfile  - specifies an alternate log file for any direct invocation
              of a facility from the command line.  The log is placed in
              /var/log/iptraf if path is not specified.
-I interval - specifies the log interval for all facilities except the IP
              traffic monitor.  Value is in minutes.
-f          - clear all locks and counters.  Use with great caution.
              Normally used to recover from an abnormal termination.

Instaling ntopng on CentOS

Mini-Tutorial: Fresh Install of ntopng on Centos

This is how to compile ntopng in a fresh centos 7 x64 installation
  • For the impatient:
    • # yum install -y subversion autoconf automake make gcc libpcap-devel libxml2-devel sqlite-devel libtool glib2-devel gcc-c++
      $ svn co https://svn.ntop.org/svn/ntop/trunk/ntopng
      $ ./autogen.sh 
      $ ./configure
      $ make
      $ ./ntopng --help
      ntopng x86_64 v.1.1.4 (r7865) - (C) 1998-14 ntop.org
      
  • Step by step description
    • Pull the source code from the ntop svn repository. To do this, you need first to install subversion using yum as follows
      $ sudo yum -y install subversion
      
    • Now change your directory to the one you want ntopng in and run
      $ svn co https://svn.ntop.org/svn/ntop/trunk/ntopng
      
    • Once the repository is downloaded, you should run the autogen.sh script
      $ ./autogen.sh
      
    • It will fail due to the lack of a autoconf packages. To step over this run
      $ sudo yum install -y autoconf automake
      
    • and re-run autogen.sh
      $ ./autogen.sh
      ......
      
    • Now autogen.sh completes successfully, then run ./configure, but it will fail due to the missing compiler
      $ ./configure
      .....
      configure: error: no acceptable C compiler found in $PATH
      
    • Install it using
      $ sudo yum install -y gcc
      Next step is the missing libpcap development package
      $ ./configure
      ......
    • Please install libpcap(-dev) (http://tcpdump.org)
      $ sudo yum install -y libpcap-devel
    • Next mandatory package is libxml2-devel required by rrd compilation
      $ ./configure
      .....
    • Please install libxml2(-devel) package (RRD prerequisite)
      $ sudo yum install -y libxml2-devel
      and glib2-devel
      $ ./configure
      .....
    • Please install libglib-2.0 (glib2-devel/libglib2.0-dev) package (RRD prerequisite)
      $ sudo yum install -y glib2-devel
    • now configure require another package
      $ ./configure
      SQLite 3.x missing (libsqlite3-dev): please install it and try again
      
    • Installable running
      $ sudo yum install -y sqlite-devel
    • Now configure works
      $ ./configure
    • You are now ready to compile typing /usr/bin/gmake
      But make will fail due the the missing c++ compiler
      $ make
      configure: error: Unable to find a working C++ compiler
      $ sudo yum install gcc-c++
      
    • After the last installed package, build will fail on json-c compilation with the following error
      $ make
      make: *** [third-party/json-c/.libs/libjson-c.a] Error 2
      
    • To solve this, install libtool package using
      $ sudo yum -y install libtool
      
    • Then rerun make
      $ make
    • and you should have everything compiled successfully.
      Test is running:
      $ ./ntopng --help
      ntopng x86_64 v.1.1.4 (r7865) - (C) 1998-14 ntop.org