Download Your Free eBooks NOW - 10 Free Linux eBooks for Administrators | 4 Free Shell Scripting eBooks
Wireshark is a open source and freely
available network analyzer tool which is shipped with most of the Linux
distributions now a days. Also wireshark runs on various Unix-like operating systems i.e Mac OS X, BSD, Solaris including Windows OS as well. Wireshark is very similar to tcpdump, but has a graphical front-end, plus great filtering and sorting options are integrated within. Here, we are installing wireshark using YUM Commands in our RHEL 6.3 system.
You must install wireshark-gnome for GUI, using yum with -y option.

 As shown below, we can see below three pane i.e top, middle and down.
 Top : In the top pane of the Wireshark window
corresponds to a single packet seen on the network. You can drill down
and obtain more information by clicking on a row. This causes the bottom
two window panes to fill with information.
Top : In the top pane of the Wireshark window
corresponds to a single packet seen on the network. You can drill down
and obtain more information by clicking on a row. This causes the bottom
two window panes to fill with information.
Middle :The middle pane contains drill-down details on the packet selected in the top frame.
Bottom : The bottom window pane shows the contents of the packet in both hexadecimal and ASCII representations.


 Tips : In addition to above, you can click the
‘Expression…’ button to discover all the filters. Also you can save the
captured data to analyze later.
Tips : In addition to above, you can click the
‘Expression…’ button to discover all the filters. Also you can save the
captured data to analyze later.
This article is for those who wants to debug and analyze the packets to and from in their network interfaces. You can also try it out and share your views through comment box below.
Wireshark Requirements
You need to have following packages installed on your system, before installing wireshark tool.- GTK+ : It a multi-platform tool used for creating graphical user interface
- Glib : It is a cross-platform tool for applications written in C language.
- libpcap : It is used to capture user-level packet and provides a portable framework for network monitoring.
- gcc : It stand for (GNU Compiler Collection) used to provide and compile C, C++ applications
Install Wireshark in RHEL/CentOS 6/5 and Fedora 17-12
Step 1: Installing Wireshark using Yum
To install wireshark package you need to have a root privilege, below step shows how to install it using yum tool.[root@tecmint ~]#yum -y install wireshark
Step 2: Installing Wireshark-Gnome GUI using Yum
[root@tecmint ~]#yum -y install wireshark-gnome
Step 3: Running Wireshark
To start wireshark, execute the following command on the terminal.[root@tecmint ~]#wireshark
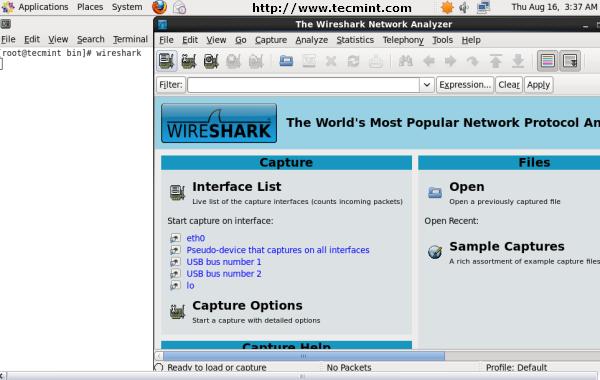
Wireshark Welcome Screen
Step 4: Wireshark Configuration and Usage
Once Wireshark is installed, start it up and to start capturing, choose a desire interfaces and press start from the Capture interfaces. You’ll see a pop-up window similar to the below.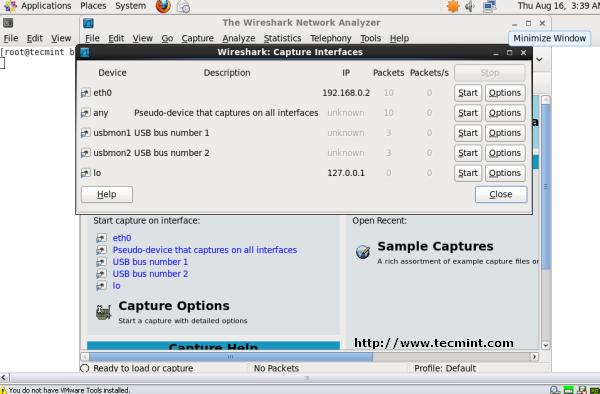
Wireshark Capture Interface
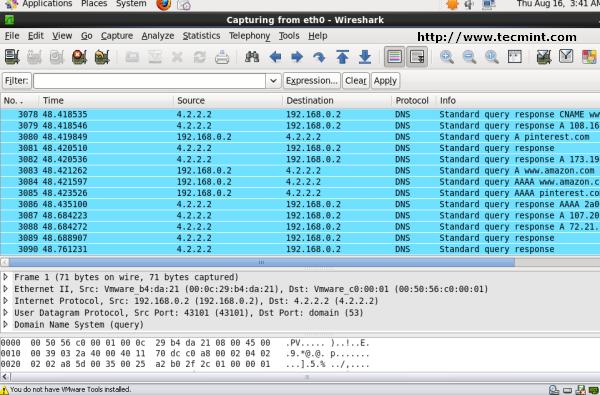
Wireshark Capturing eth0
Middle :The middle pane contains drill-down details on the packet selected in the top frame.
Bottom : The bottom window pane shows the contents of the packet in both hexadecimal and ASCII representations.
Step 5: Filter by source IP Address.
This will filter the packets only from source IP in filter tab as shown below.ip.src==192.168.0.2
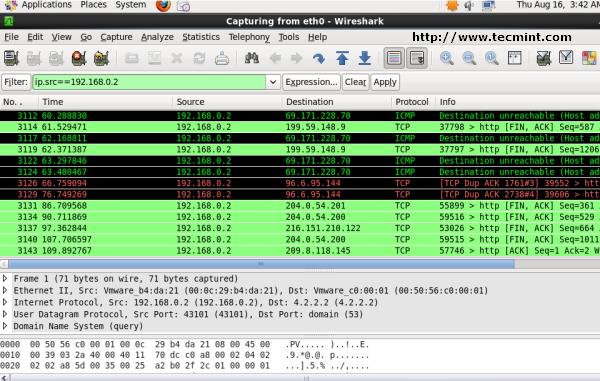
Wireshark – Filter by source IP Address
Step 6: Filter by destination IP Address
This will filter the packet view in wireshark to only those packets that have destination IP as mentioned in the filter.ip.dst==69.171.228.70
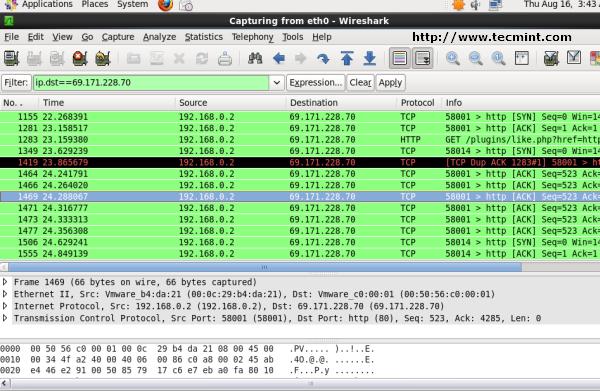
Wireshark – Filter by destination IP Address
Step 7: Filter by Protocol
This will filter the packet view in wireshark to only those packets that have http packets mentioned in the filter.http
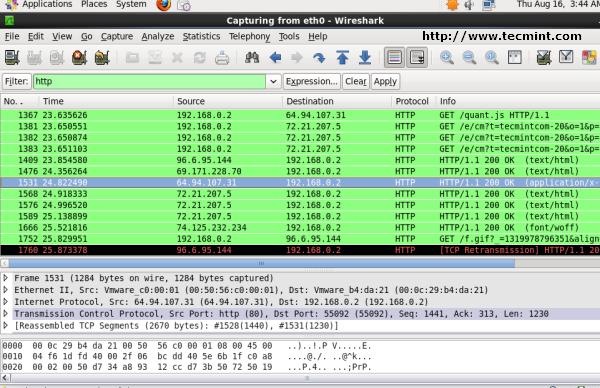
Wireshark – Filter by Protocol
Step 8: Filter by || (OR) Condition
This will filter the packets that match either one or the other condition.http||arp
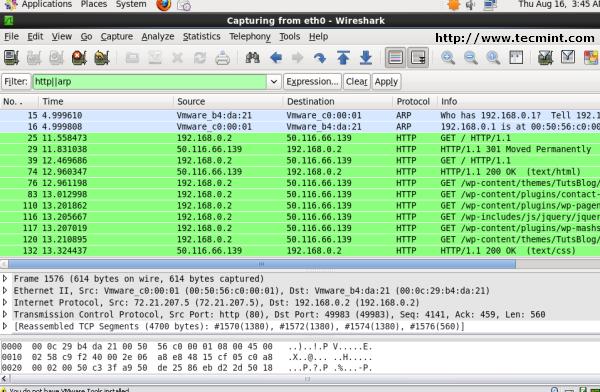
Wireshark – Filter by || (OR) Condition
Step 9: Filter by && (AND) condition
This will filter the packet view in wireshark to only tcp packets and have source ip as 192.168.0.2tcp&&ip.src==192.168.0.2
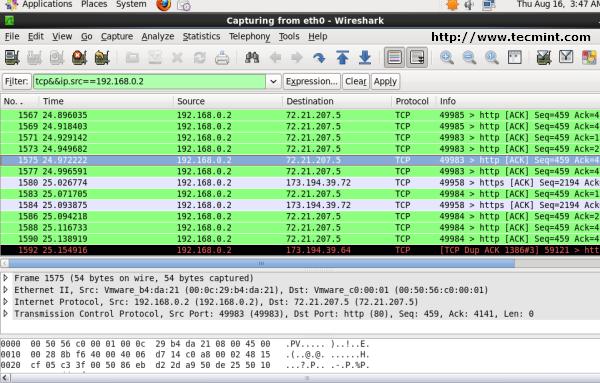
Wireshark – Filter by && (AND) condition
Step 10 Filter by Port number
Filter by tcp port number 80.tcp.port eq 80
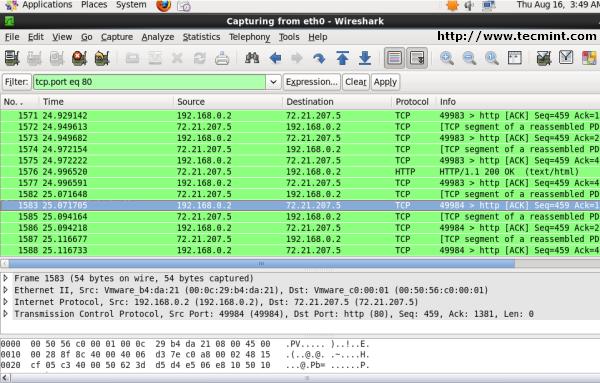
Wireshark – Filter by Port number
This article is for those who wants to debug and analyze the packets to and from in their network interfaces. You can also try it out and share your views through comment box below.
No comments:
Post a Comment